
By Marc Gilman
(800) 927-9326 |
Key Takeaways
-
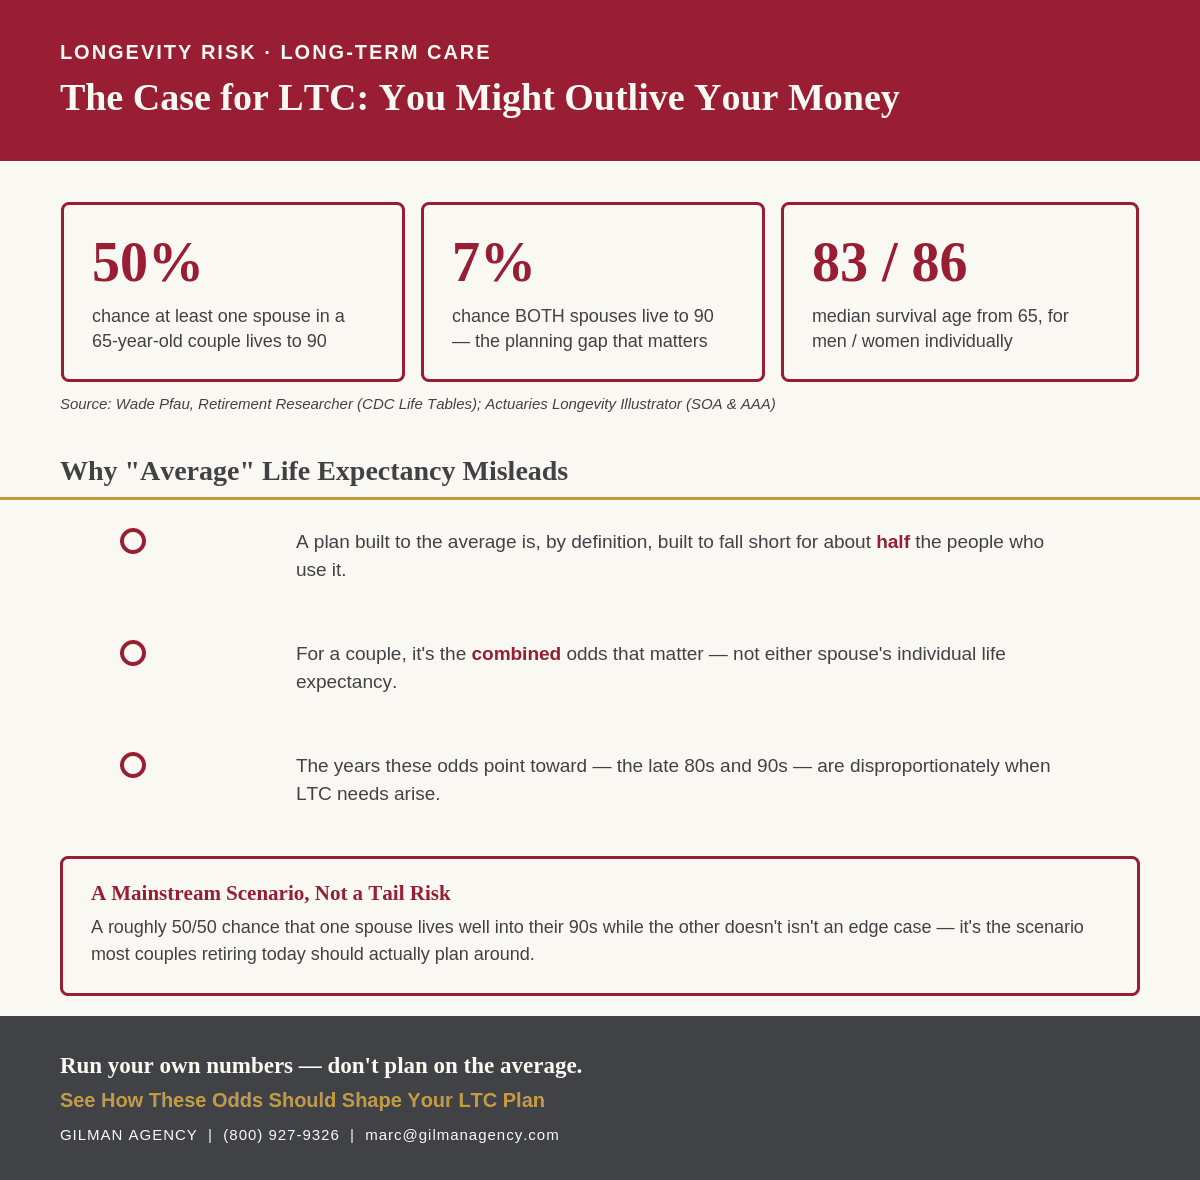
For a 65-year-old couple, there’s roughly a 50% chance that at least one of them will live to age 90 — but only about 7% that both of them do. That gap between “one spouse” and “both spouses” is exactly the scenario that catches retirement and long-term care plans off guard.
-
Individual odds are lower than the couple’s combined odds — it’s the joint probability, not either person’s individual life expectancy, that actually drives retirement planning.
-
A plan built around “average” life expectancy is, by definition, built to run short for roughly half of the people who use it.
-
Longevity risk and long-term care risk are closely linked: the extra years a couple’s combined odds point toward are disproportionately the years when care needs are most likely to arise.
Why Does “Average” Life Expectancy Undersell the Real Risk?
Most retirement conversations start with life expectancy — a single number, like “a 65-year-old man can expect to live to 84.” The problem is that a single number hides the shape of the actual risk. Roughly half of any group lives longer than its average life expectancy, sometimes by a decade or more, and a retirement plan built only to the average is, by construction, a plan designed to fall short for about half the people who use it.
The Society of Actuaries and American Academy of Actuaries built a free tool specifically to address this blind spot: the Actuaries Longevity Illustrator. Rather than a single expected age, it shows the actual probability of reaching various ages, based on Social Security Administration mortality data with ongoing mortality improvement factored in. The result reframes the question from “how long am I expected to live” to “what are the odds I’m still here at 85, 90, or 95” — a much more useful question for deciding how long your money actually needs to last.
What Does the Math Look Like for a Couple?
This is where the picture changes the most. For a single 65-year-old, the odds of reaching 90 are meaningful but not overwhelming. For a couple, the relevant number isn’t either person’s individual odds — it’s the probability that at least one of them reaches an advanced age, and that combined probability is substantially higher than either individual’s odds alone.
For a 65-year-old couple in average health, the Actuaries Longevity Illustrator puts the odds that at least one of them lives to age 90 at roughly 50% — essentially a coin flip. Independent longevity research confirms the same figure: retirement researcher Wade Pfau, using CDC life table data, puts the odds at about 50% that one of two 65-year-old spouses reaches 90 — though only about 7% that both of them do. That gap matters for planning. It’s a mainstream scenario that one spouse lives well into their 90s while the other doesn’t, which is exactly the situation that tends to catch retirement income plans off guard.
For context on the individual numbers behind that combined figure: among people who’ve already reached age 70, more than one in five men go on to reach 90, and roughly one in three women do — women consistently show a higher probability of reaching advanced ages than men at every stage. Starting from age 65 specifically, CDC data shows a 65-year-old man has roughly a 50% chance of living to 83, and a 65-year-old woman has that same 50% chance of living to 86. It’s the combination of both partners’ odds — not either one alone — that produces the roughly 50% figure for at least one member of the couple reaching 90.
Why Does This Matter Specifically for Long-Term Care?
The years a couple’s combined odds are pointing toward — the late 80s and 90s — are disproportionately the years when long-term care needs actually arise. Longevity risk and long-term care risk aren’t two separate planning problems; they’re largely the same problem viewed from different angles. A plan that only accounts for average life expectancy doesn’t just risk running short on income — it risks running short during exactly the years when care costs are most likely to show up.
This is also why the “it probably won’t happen to me” instinct doesn’t hold up well against the actual math. A roughly 50/50 chance isn’t a tail risk or an edge case — it’s a mainstream planning scenario for the average couple walking into retirement today.
Where Does Insurance Planning Fit In?
Standalone long-term care insurance, hybrid life insurance with an LTC rider, and annuity LTC riders are all built to address exactly this scenario — extending protection into the years a couple’s combined longevity odds make genuinely likely, not just theoretically possible. Which structure fits best depends on your health, your assets, and your specific planning goals. For a fuller walk-through of how these options compare, see our complete guide to long-term care insurance.
What To Do Next
If you haven’t run your own numbers through a longevity calculator, or want to understand how these odds should actually shape your long-term care and retirement income plan, Gilman Agency can walk through it with you.
Call us at (800) 927-9326 or email to schedule a review.
Sources: Wade Pfau, “How Long Can Retirees Expect To Live Once They Hit 65?” Retirement Researcher (CDC United States Life Tables, 2022 data); Actuaries Longevity Illustrator, American Academy of Actuaries and Society of Actuaries (longevityillustrator.org); Kiplinger, “Longevity Illustrator: Find Out How Long You Might Live”; “What Are the Odds of Living to 90?” Biology Insights (December 2025); Stanford Center on Longevity, “Understanding Longevity” toolkit brief.


